 or
Y-Axis
  tools, and select Custom from
the list
tools, and select Custom from
the listYou may choose to remove or add individual replicates from a replicate set for display on the Scatter Plot by using the Edit Scatter Plot Axis window.
This window may be accessed in two ways:
Click either the X-Axis  or
Y-Axis
  tools, and select Custom from
the list
Click on the current axis title displayed on your Scatter Plot and select Custom from the list displayed.
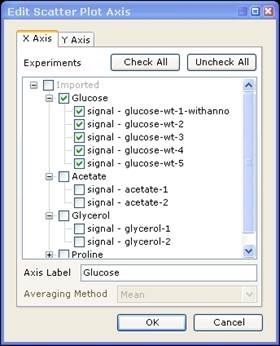
The Edit Scatter Plot Axis window will be displayed, as shown below:

The Edit Scatter Plot Axis window has two tabs; one for the X Axis, and one for the Y Axis.
•Select the replicates to be plotted on each axis by checking the boxes next to each replicate name.
•You may rename the label in the Axis Label field.
•When more than one data set is selected per axis, they will be averaged before display on the graph.
•Select either Mean or Median averaging in the Averaging Method field for averaging multiple selections.
When you are finished, click OK to view the customized data set plotted on the Scatter Plot.