.
. The Info Pane appears to the right of the Experiment List view and gives information about
the data displayed. The Info Pane is separated from the rest of the Experiment
List view by a splitter bar which can be dragged to resize the window. The Info
Pane may be hidden or shown by using the Hide/Show Info Pane tool .
Details section:
This section appears on the right of the Experiment List and describes the experiment, replicate set, or category that is currently selected in the Experiment List.
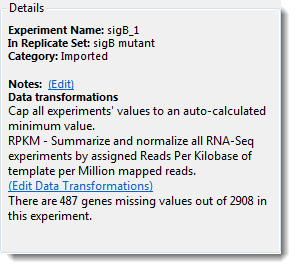
Depending on the selection, a subset of the following information will be available:
•The experiment, category, or replicate set name
•The number of selected items, or the number of replicates contained in the set
•The current Data transformation/normalization method (only for RNA-Seq experiments)
•The averaging method (mean or median)
•Any Notes you have added
Depending on the selection, one or more of the following links may be available:
•Edit – To add or edit notes.
•Edit Data Transformations – To select a different normalization method (RNA-Seq experiments only).
•Show log – One or more of Show log links are provided whenever DESeq2 or edgeR was selected as the normalization method in SeqMan NGen and ArrayStar. Clicking each link displays a Bioconductor script/log which you can use for QC/QA purposes or even include in publications.
Occasionally, you may see a message in this section notifying you that some genes are missing. For example:
“There are 4212 genes missing values out of 27709 genes in this experiment."
This message may appear for any of the following reasons:
•The annotation file imported for your project contains annotations for genes that are not present in your experiments. If this is unexpected, importing the correct annotation file should solve the problem (see Import Annotations). Or, if you imported annotations during project setup, first verify that you designated the correct columns during the import, and then re-import if necessary.
•Some of the chips in your project contain genes that are not present on other chips in the same project. If this is unexpected, importing the correct data file should solve the problem. Or, if you imported your data through the Data Import Wizard, first verify that you designated the correct columns during the import, and then re-import if necessary.
•Some of the genes in your project do not have signal values associated with them. You can look in the Gene Table to find genes that are missing values. Genes without signals will show “---“ in place of signal values. In this case, it may be beneficial to add more replicates if possible, and then group your replicates into replicate sets. The averaging method that you select for each replicate set (mean or median) will determine how the missing values are handled. In both cases, the missing replicates will not be counted for that gene. In mean averaging, any gene that has no value in one or more replicates will cause the other replicates to have more weight for that gene.
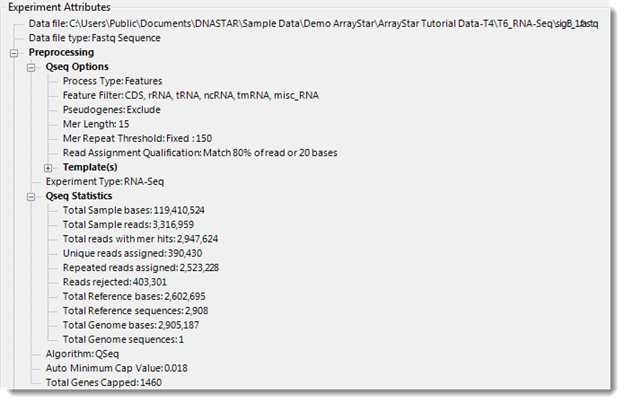
Experiment Attributes section:
This section displays data from any attribute file that you imported, as well as the attribute file location and type.
If ArrayStar normalized your data during import, the preprocessing parameters used for normalization will be displayed here. QSeq experiments also display read assignment results in this section. If you logged into the Variant Annotation Database during project setup, the Experiment Attributes section will be enriched with additional statistics and other information. Note that you may observe different numbers than expected if novel mutations were found.
For more information on how reads are assigned, see QSeq Advanced Options.