
If you are viewing an assembly created in SeqMan NGen, you can add a track to the Analysis view showing each of the aligned reads in the selected experiment using the method described in Work with Tracks. Briefly, you can display an Alignment track by opening the Tracks panel and checking one or more of the boxes to the left of Analysis body > Alignment > (sample names).
The look of the track varies by project type and zoom level.
| Scenario | Appearance of track |
|---|---|
| Non-phased assembly, zoomed in | Base codes are displayed in gray.  Letters in contrasting colors indicate variants of different types. |
| Phased assembly, zoomed in | Base codes are displayed in green or blue, corresponding with the phase blocks in the Genome view.  Letters in contrasting colors indicate variants of different types. |
| Non-phased assembly, zoomed out | Displays green and red arrows representing forward and reverse reads, respectively. 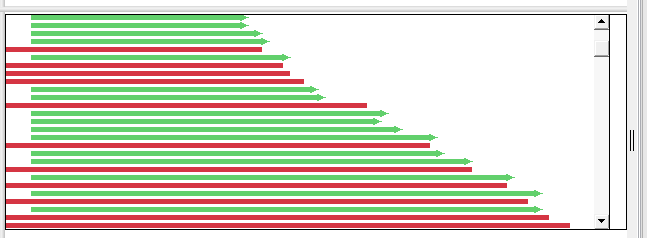 |
| Phased assembly, zoomed out | By default, displays phased reads as alternating bands of green or blue and unphased reads as bands of gray. (Reads are defined as “unphased” if they do not have heterozygous sites or if the pattern of sites does not match the other reads.) Variants of different types are indicated by vertical bars. The following image is a single screenshot of a small portion of an alignment track for a phased assembly. The track has been expanded to full height by pulling down on the “grab bar” in the bottom center of the track. Labels have been added to the image to show how the default colors are used to indicate membership in a phase block and association with a particular allele (parent). Note that the assignment to one allele or the other is random from one phase block to the next.  Colors used to indicate alternating phase blocks and the two alleles for each can be customized using the procedure described below this table. |
Tasks related to Alignment tracks in the Analysis view:
| Task | How To |
|---|---|
| View a tool tip with details about a position or phase block in the alignment | Hover over the position or phase block with the mouse. Click on the position or phase block to view information about it in the Details panel. |
| Resize the track vertically | Use the slider that appears if you hover over the bottom middle of the track data. You can also resize the track and change the amount of white space above/below the track using sliders in the Layout section. |
| Display a popup toolbar | Select an Alignment track in the Analysis view. The toolbar will pop up at the top-left of the track. All tools referred to below this row are located in the popup toolbar. You can use your mouse to grab the popup on its left end and drag it to any desired location in the view. |
| Close the popup toolbar | Use the Close popup tool ( ). ). |
| Display quality score information | Click the Quality scores tool ( ) and choose between Don’t show scores and Show scores. This option is only available for assemblies created using Sanger (.abi) reads. ) and choose between Don’t show scores and Show scores. This option is only available for assemblies created using Sanger (.abi) reads. 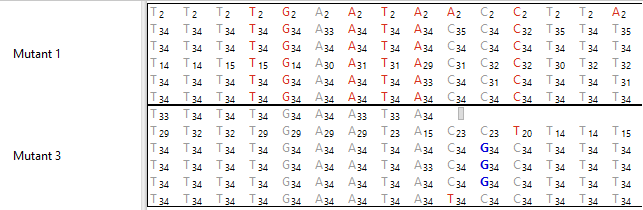 An option for displaying averaged quality scores is available in the track options section (see last row in this table). |
| Export the alignment consensus | Click on the Export data tool ( ). See Export data to a file for detailed instructions. ). See Export data to a file for detailed instructions. |
| Open the Tracks panel | Click the “hamburger menu” ( ) and choose Tracks. ) and choose Tracks. |
| Open the Layout section for the Alignment track. | Click the “hamburger menu” () and choose Options. |
| Change Alignment track options | Select the Alignment track in the Tracks panel and then click the Options tab to expand the Options section. The first two options below are available for all Alignment tracks. The full set of options is only available for phased assemblies created using long-read data in SeqMan NGen. 
|
 if you wish to return to the default values.
Need more help with this?
Contact DNASTAR