
With the release of Lasergene 18, SeqMan NGen’s templated RNA-Seq workflow supports gene set enrichment analysis (GSEA), a computational method provided by a collaboration of University of California-San Diego and The Broad Institute (Subramanian et al., 2005).
In GSEA, a ranked list of genes from an RNA-Seq experiment are compared it to predefined gene sets (e.g., pathways from KEGG or GO). By calculating an enrichment score, GSEA can determine whether genes within a specific pathway are clustered at the top or bottom of the ranked list, suggesting their coordinated involvement in a particular biological process.
GSEA is useful for learning whether a predefined set of genes shows statistically significant differences between two biological states (e.g., phenotypes). You can then focus on groups of genes that share some commonality, such as regulation, chromosomal location, or biological function.
Note that while they may seem similar, GSEA is an analysis method while Gene Ontology is a dataset. One key difference is that GSEA does not require a cutoff. All genes are included and the fold change between groups is used to rank them.
Including GSEA statistics in a SeqMan NGen assembly:
- In the Workflow screen, select RNA-Seq / Transcriptomics on the left and RNA-Seq from the Quantitative Analysis section on the right.
- In the Reference Sequence screen, select a genome reference for human, mouse, yeast, or C. elegans. These are the only species currently supported for GSEA analysis.
- In the Input Sequences screen, choose Multi-sample with replicates as the Experiment setup. Then add sequences and create replicates.
- In the Set Up Replicate Sets screen, group the replicates by sample.
- In the Set Up Experiments screen, check one of the Is Control? boxes.
- Choose any desired options in the Assembly Options screen.
- In the Analysis Options screen:
- Specify DESeq2 or edgeR as the Normalization method.
- Check the box next to Gene set enrichment analysis. Then select the desired gene analysis option from the drop-down menu on the right. Choose from 31 options for human or 19 options for mouse; C. elegans and yeast each have one unchangeable default option.
- Specify DESeq2 or edgeR as the Normalization method.
- Complete the remaining screens as desired.
- After assembly, look in your assembly results folder to locate a folder named BioConductor. This folder includes:
- A bubble plot that lists genes from the chosen analysis set that are also differentially expressed.
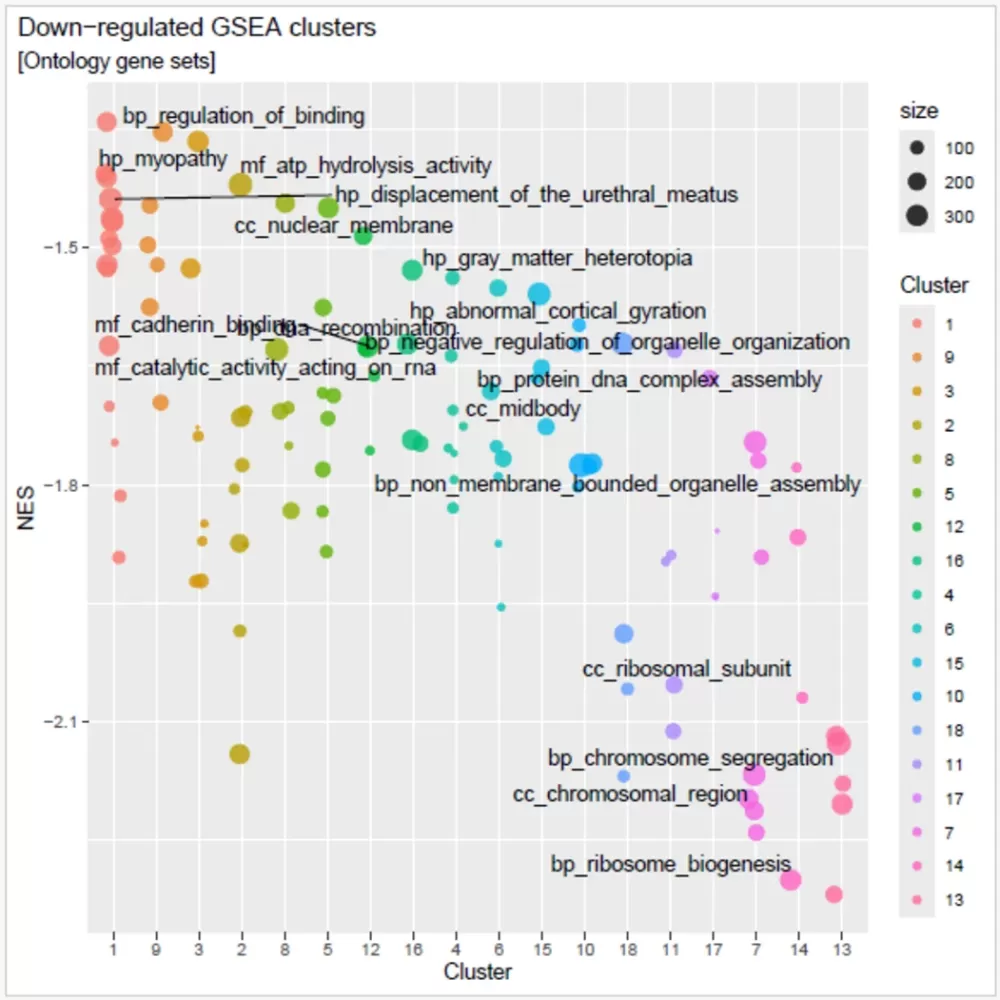
- A clustering plot (image below) that show up-regulated and down-regulated gene sets.
![]()
- A bubble plot that lists genes from the chosen analysis set that are also differentially expressed.
Need more help with this?
Contact DNASTAR