Using DNASTAR’s Nova Apps to Streamline Structure Prediction
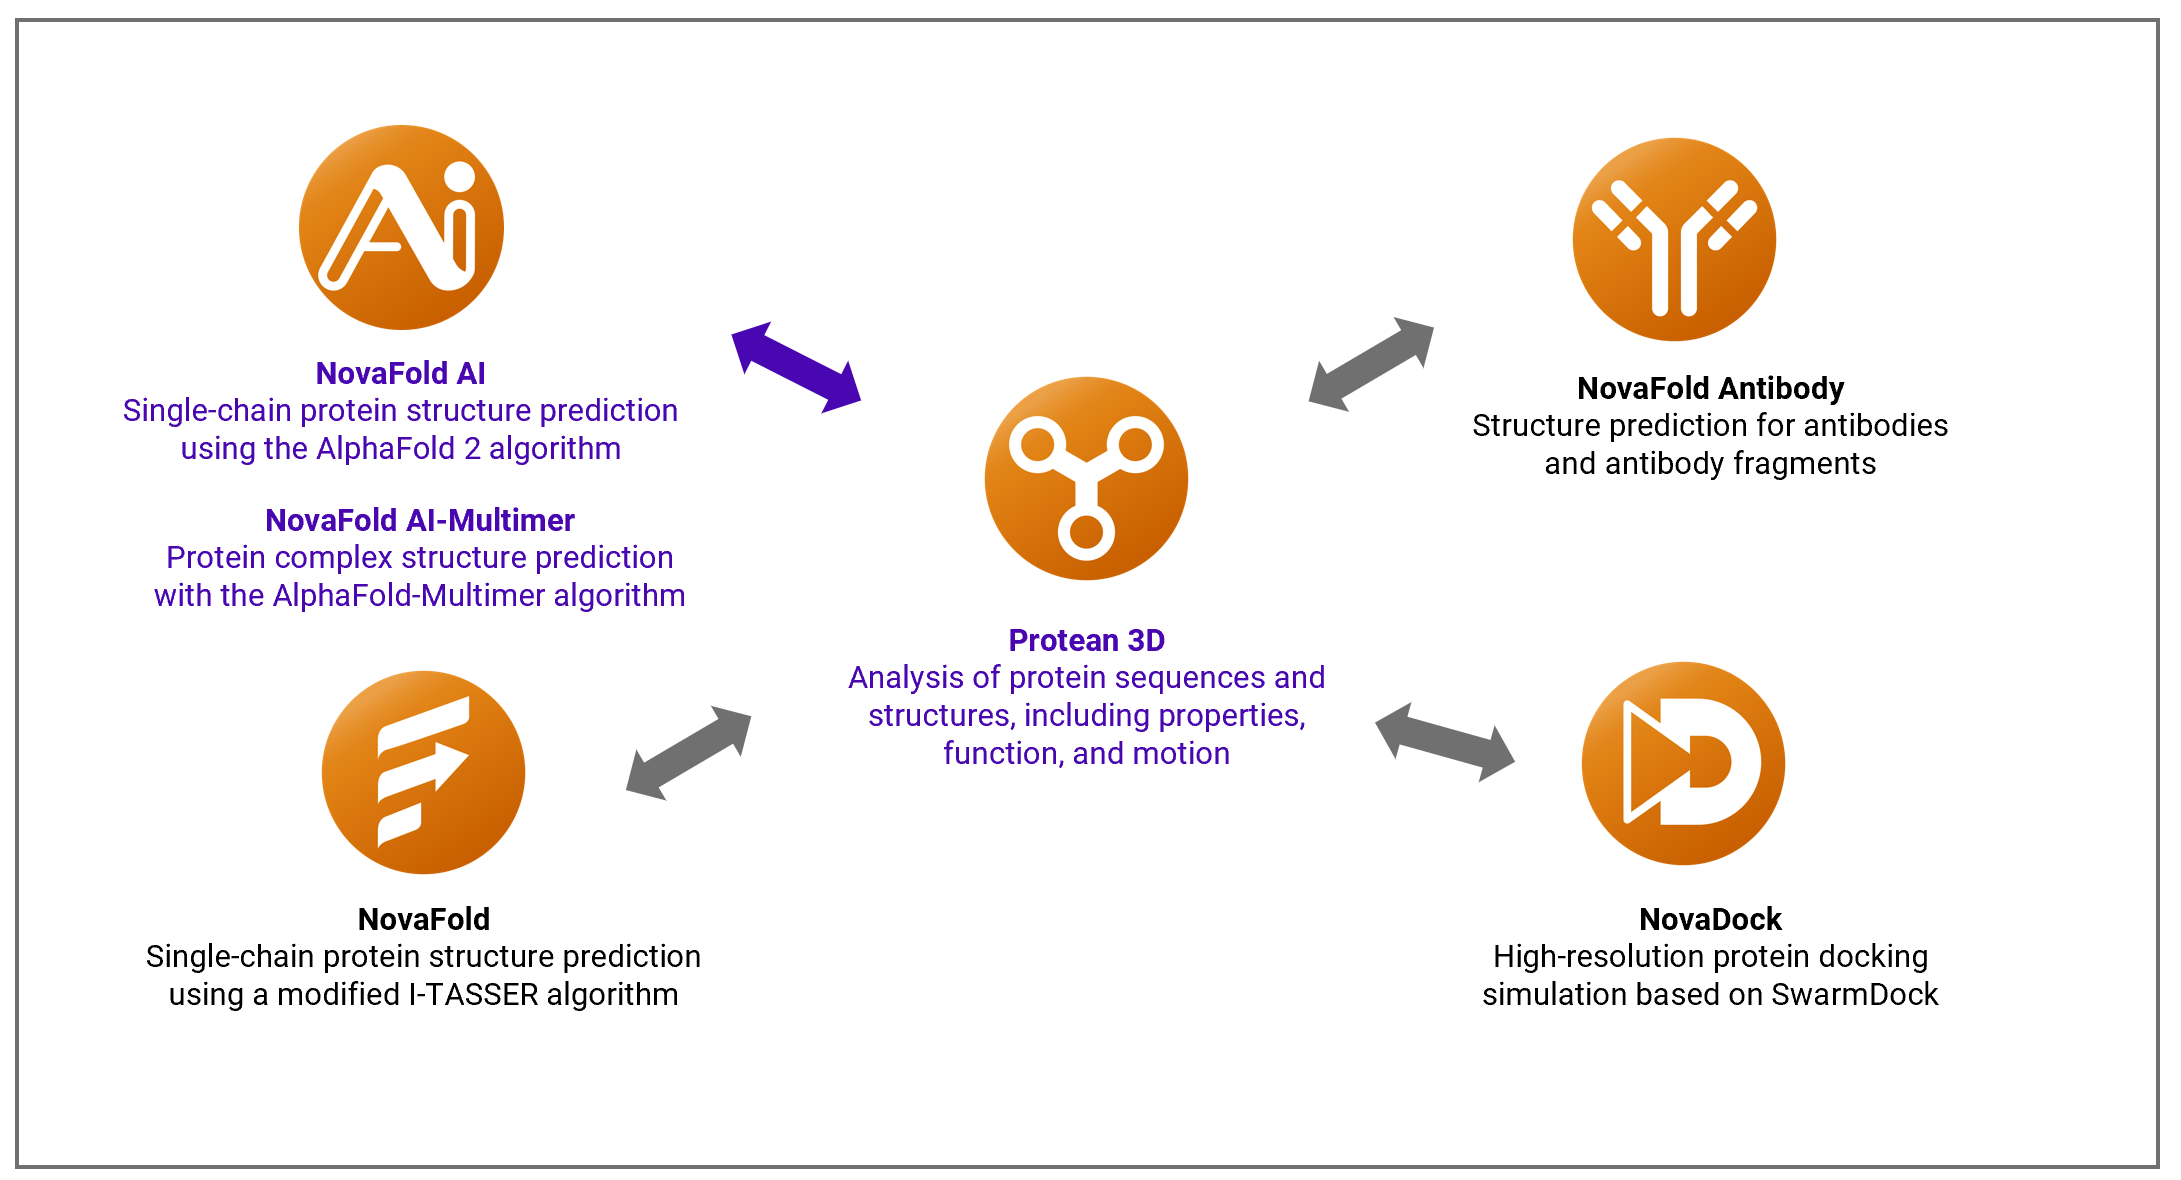
The applications in DNASTAR’s Lasergene Protein package support the exploration of protein structure, motion, function, and interaction. The flagship application is Protean 3D, easy-to-use standalone software that is also used to set up predictions and view results from each of our five separately- licensed protein prediction applications known as the Nova Applications (Figure 2).

Figure 2. Protean 3D is a standalone application that is also used to set up Nova Application predictions and analyze their results.
These applications provide access to powerful prediction algorithms such as I-TASSER, SwarmDock, AlphaFold 2, and AlphaFold-Multimer. These workflows provide practical and fast ways to accelerate drug/antibody development, and to study structural pathways for interactions between molecules.
Using a simple guided workflow, it takes only a few minutes to install Lasergene and less than a minute to set up and begin running a protein structure prediction. Results can be viewed and analyzed in the same application where you do the prediction setup, typically within a few minutes or hours.
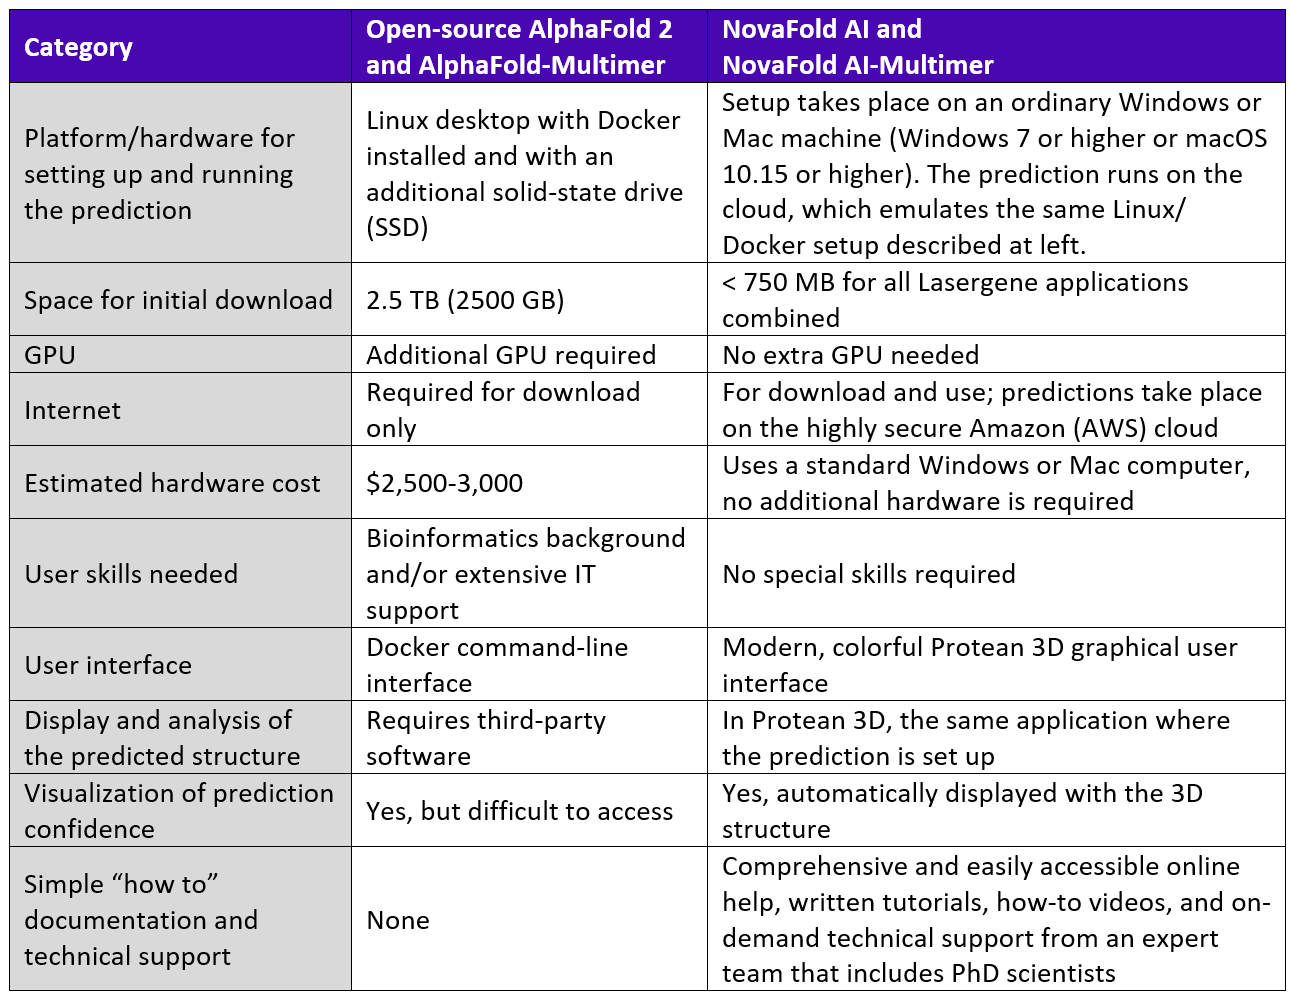
Setting up the prediction and analyzing the results both take place on a standard Windows or Mac computer, eliminating the need for a specialized computer. Little disk space is required for these tasks, as the entire 2.5 TB AlphaFold 2 library is stored online with NovaCloud, using SSD-backed file share storage. Predictions all take place on the cloud as well. NovaCloud has a dedicated GPU, which is important during the AI inference and energy minimization phases of the prediction.

Table 2. Requirement comparison for open source AlphaFold algorithms vs. accessing the same algorithms through the Nova Applications.
Using NovaFold AI to predict the structure of a chimeric FliC- FliS fusion protein
To demonstrate how NovaFold AI can streamline structure prediction with AlphaFold 2 and make it easy to perform downstream analysis, we present the following use case.
Fusion proteins are artificial constructs that are commonly used to explore how different protein fragments interact with one another at the atomic level. Because they are not naturally-occurring proteins, they are never included in the public AlphaFold 2 structure database described in Chapter 2 of this guide.
Fusion proteins are difficult to model with template-based structure prediction algorithms since there are no templates available that combine elements of two diverse structures. But unlike other algorithms, AlphaFold 2 can recognize folds from two different sources and combine them into a single distance matrix, allowing it to predict the composite structure.
However, we have described how open source AlphaFold 2 can be cumbersome and expensive to run due to specialized computer requirements. In this example, we’ll show how easy it is to model a fusion protein with this algorithm using NovaFold AI on a standard laptop.
In the following steps, we predict the structure of the chimeric FliC-FliS fusion protein (PDB ID: 4IWB) that features two pieces of bacterial flagella fused together in a novel way. The structure was solved by x-ray diffraction and added to the PDB database on 1/23/2013.
Step 1: Obtain the protein sequence
To obtain a FASTA sequence for this protein, we went to the 4IWB entry at the PDB website (Figure 3), clicked on the blue Download Files button and chose FASTA Sequence.

Figure 3. Part of the 4IWB entry at the Protein Data Bank website.
Step 2. Set up and run the prediction using NovaFold AI
From the Protean 3D Welcome screen (Figure 4), we clicked Structure Prediction and then New protein structure with NovaFold AI.

Figure 4. The Protean 3D Welcome screen showing the launch point for the NovaFold AI workflow.
The NovaFold AI wizard opened at the Sequences screen. We used the Add File button to upload the FASTA file (Figure 5).

Figure 5. The NovaFold AI Sequences screen after adding the FASTA file.
Clicking Next > took us to a screen where we could customize prediction options.
To ensure fairness in this example, we want to ensure that the 4IWB structure cannot be used as a template by the AlphaFold 2 algorithm. We therefore selected a template cutoff date of 1/22/2013, the day before the structure was submitted to PDB (Figure 6).

Figure 6. The NovaFold AI Options screen with the template cutoff date entered.
Finally, we clicked Submit to begin the prediction. This prediction took about 1.5 minutes to set up and 41 minutes to complete.
Step 3. Analyze the predicted structure
Once the structure was predicted, an active link appeared in the Predictions view (Figure 7).

Figure 7. The link for the most recent prediction appears at the top of the Protean 3D Predictions view.
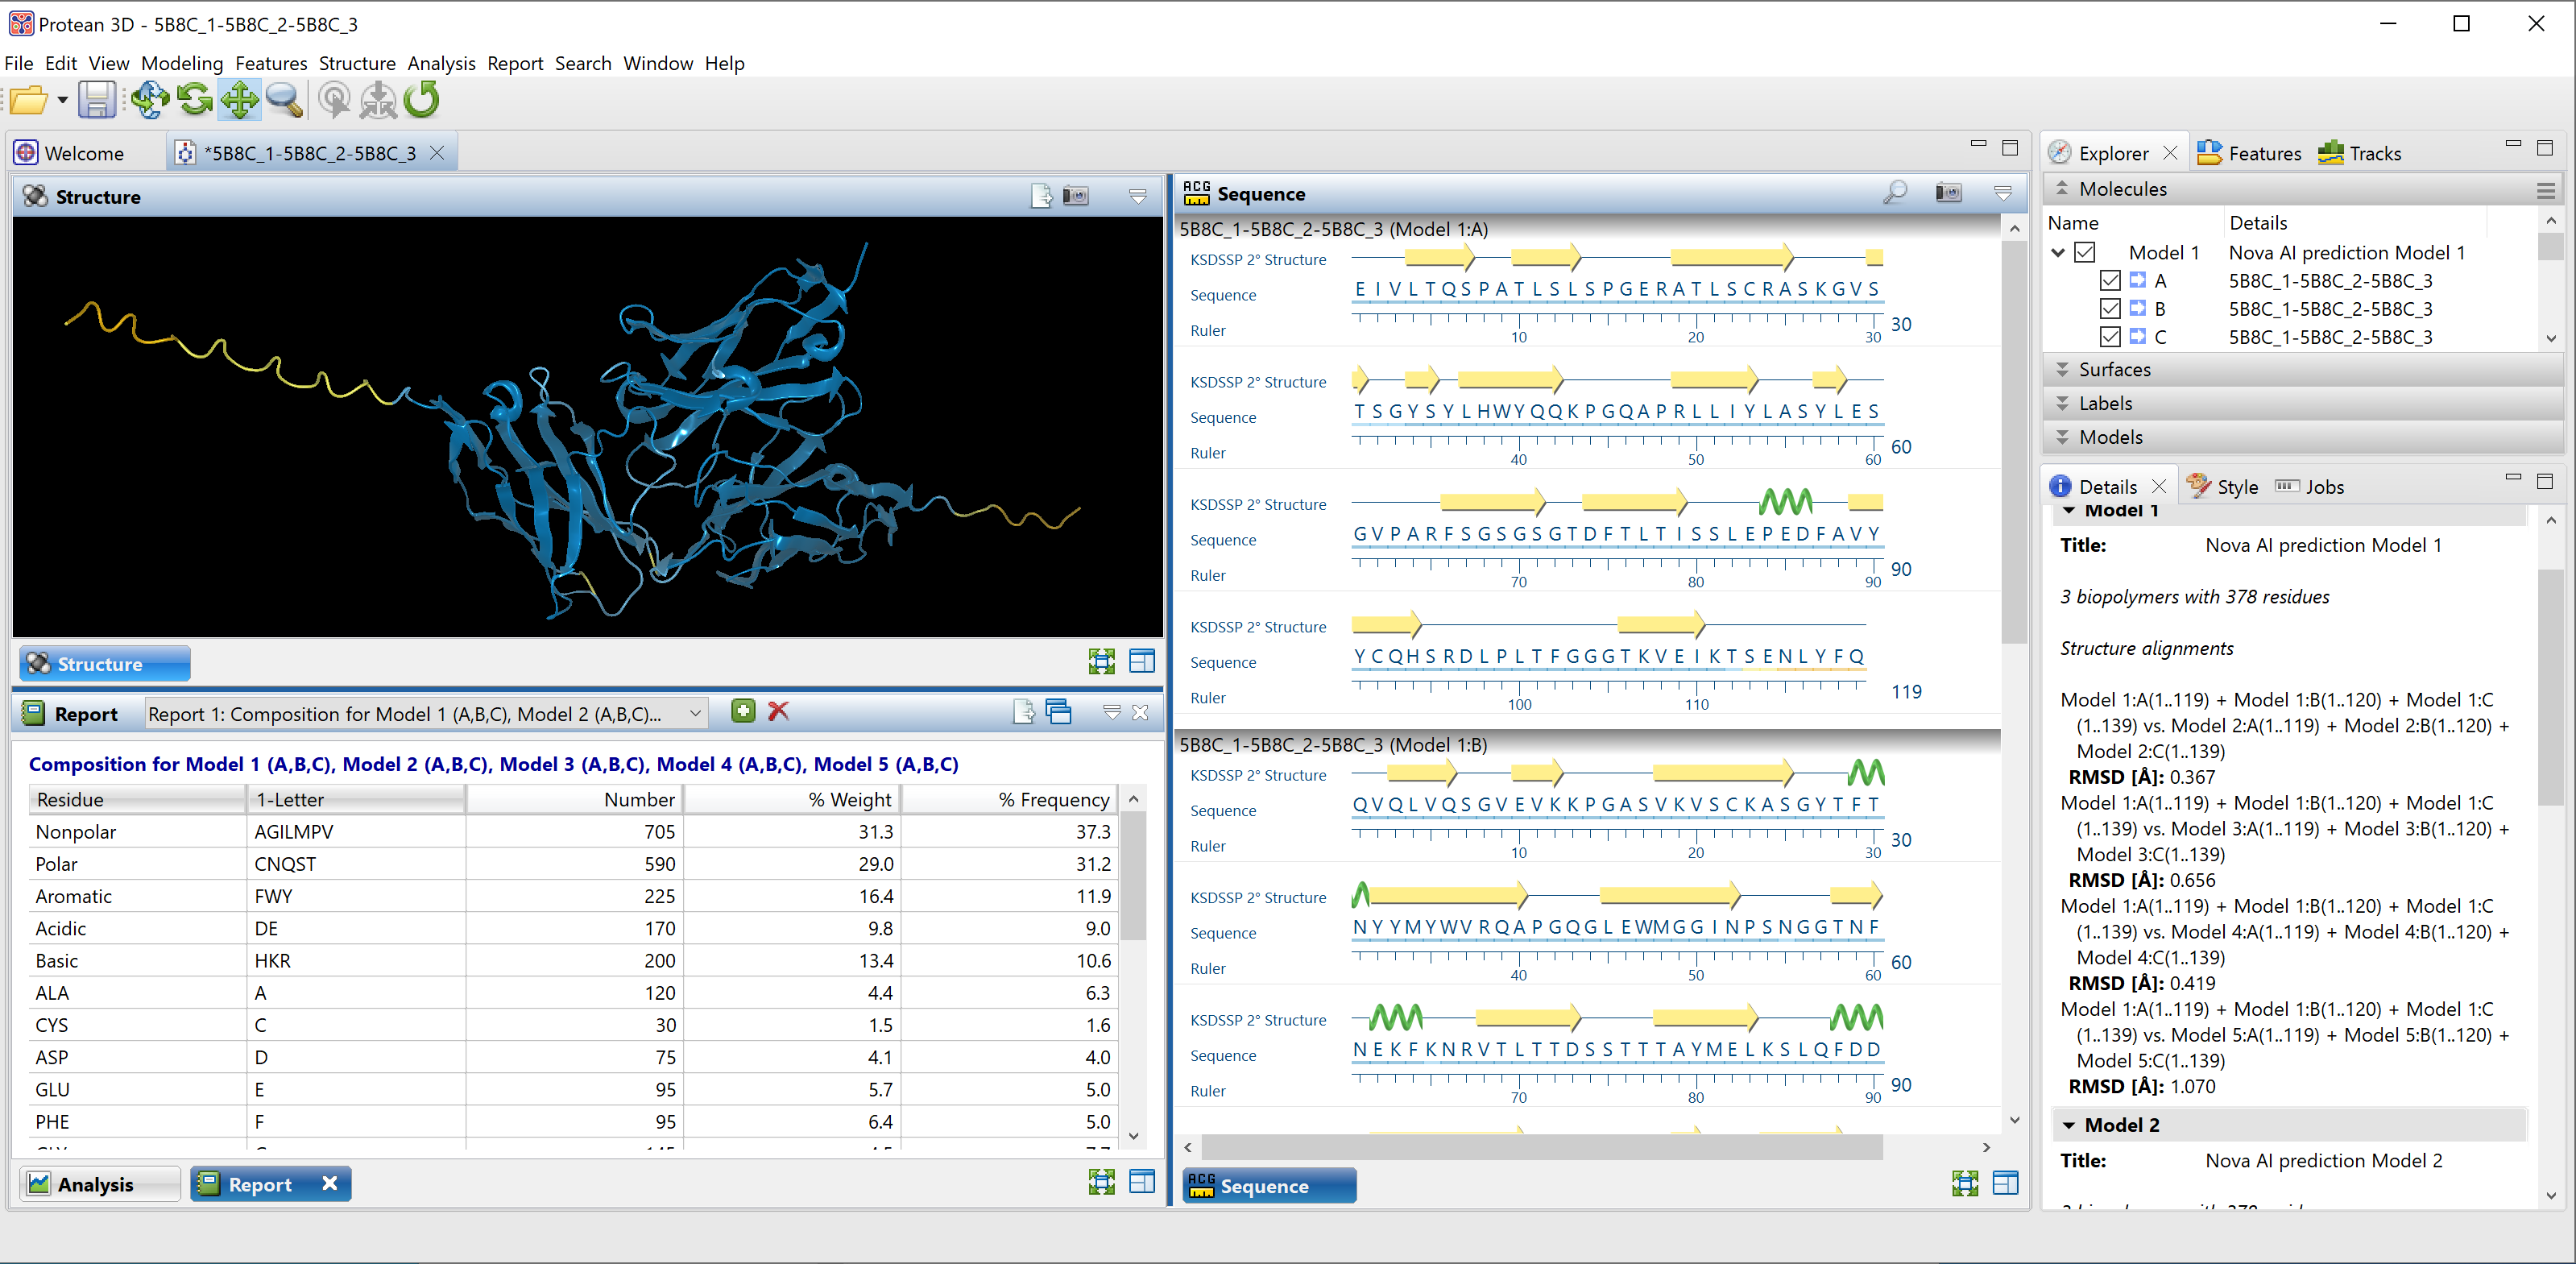
We clicked this link to open the predicted structure in the Structure view (top left of Figure 8). Initially, the top 5 models are shown overlaid, with the Model Report (bottom left) showing their Local Distance Difference Test* (LDDT) scores.

Figure 8. The top 5 prediction models overlaid in Protean 3D.
* LDDT is a “superposition-free score that evaluates local distance differences of all atoms in a model, including validation of stereochemical plausibility.”
Reference: Mariani V, Biasini M, et al. LDDT: a local superposition-free score for comparing protein structures and models using distance difference tests, Bioinformatics, Volume 29, Issue 21, 1 November 2013, Pages 2722–2728.
Comparing the predicted model to the PDB structure
How did the Model 1 structure prediction compare to the structure that was determined using x-ray crystallography? To find out, we used Protean 3D to align the prediction with the PDB structure using the Structure > Align Structures > Structure Alignment command. We used the Style panel to color the NovaFold AI prediction orange and the PDB (x-ray diffraction) structure blue (Figure 9). Rotating the structure in the Structure view showed that the predicted and known structures were nearly indistinguishable when viewed from any angle.

Figure 9. The prediction made by NovaFold AI (orange) aligned with the x-ray diffraction-determined
structure from PDB (blue).
Using a more objective measurement of accuracy, we can look at the root mean square deviation* (RSMD) values for the alignment between the top five predicted models and the known structure. There is no absolute rule for determining a match for aligned proteins, but a value under 2.0 Å (angstrom, 10-10 m) is generally considered to signify a very close match. In this example, the RMSD values for the five alignments were all under 0.7, with the top-ranked model having an RMSD of just 0.379 Å (see the Details panel in Figure 7 on the previous page).
* RSMD is measure of the average distance between the atoms (usually the backbone atoms) of superimposed proteins.
Setting up and running a prediction with NovaFold AI-Multimer
Similarly to how NovaFold AI streamlines the process for AlphaFold 2, NovaFold AI-Multimer enhances the ease of setting up and running predictions with AlphaFold-Multimer. As shown below, setting up a prediction takes around 1-2 minutes and as few as three steps.
Before you begin, ensure that all sequences involved in the multimer structure prediction are included in a single protein file in FASTA format. If you are modeling a homomultimer, the file will contain multiple entries of the same sequence (e.g., three copies of the same sequence if modeling a homotrimer).
Step 1: Launch Protean and choose File > New NovaCloud Prediction to launch the Prediction view. Then click on NovaFold AI Multimer (Figure 10).

Figure 10. Clicking on NovaFold AI Multimer launches the prediction setup wizard.
Step 2: The first wizard screen is the Sequences screen (Figure 11). Click the Add File button to upload one or more protein files in FASTA format. Each file represents a separate prediction job.

Figure 11. In the Sequences screen, you can add sequence files using “Add File” or type/paste in sequence using “Enter.”
Step 3: If you want to specify custom prediction options, skip to Step 4. Otherwise, click Submit to start the prediction and omit Step 4.
Step 4 (optional): To specify custom prediction options, click Next to proceed to the Options screen (Figure 12). Set up options as desired and click Submit to begin the prediction.

Figure 12. The Options screen lets you customize settings for the prediction.
Once the current prediction has finished, an active link appears at the top of the Predictions view (Figure 13).

Figure 13. The Predictions view shows present and past predictions in list format. Click on any finished prediction to open it in Protean 3D. You can also right-click on a prediction to download it.
Click the link to open the predicted structure in the Structure view (Figure 14).


