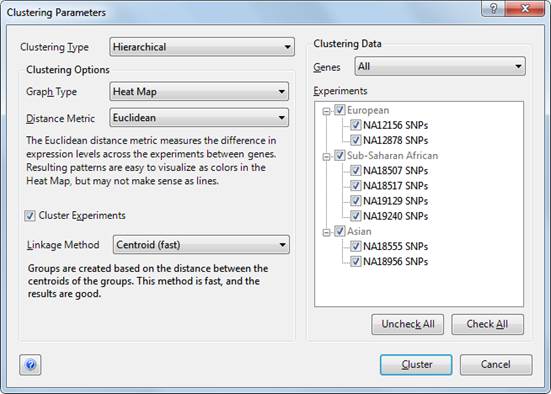
Clustering parameters are adjusted using the Clustering Parameters dialog. To open the dialog, choose Clustering > Advanced Clustering.
•Clustering Type: Select the method of clustering to be performed, either Hierarchical or k-Means.
•Graph Type: Select the type of visualization for your clustering. By default, Hierarchical Clustering is displayed in the Heat Map view, and k-Means Clustering is displayed in the Line Graph Thumbnails view.
•Distance Metric: Select the distance metric to be used by the clustering type you selected.
|
Euclidean |
Measures the difference in signals across the experiments between genes. The resulting patterns are best visualized as colors in the Heat Map view. This is the default metric for Hierarchical Clustering. |
|
Euclidean-Squared |
Generates the same clustering results as Euclidean but scales the hierarchical trees differently. In general, the center of the hierarchical trees will be expanded using this metric. |
|
Manhattan (City Block) |
Measures the difference in signals across the experiments between genes but is simplistic and may exaggerate the differences that appear in multiple experiments. |
|
Standard Pearson |
This correlation coefficient measures the difference both in trends between genes and in the actual signals. The results are best visualized as lines in the Line Graph Thumbnails view. This is the default distance metric for k-Means Clustering. |
|
Uncentered Pearson |
This correlation coefficient measures the difference only in trends between genes, not in the actual signals. The results are best visualized as lines in the Line Graph Thumbnails view. |
•Cluster Experiments: Check this box if you wish to perform clustering on your experiments as well as the genes you have selected. Experiment clusters are displayed in the Experiment Tree in the Heat Map view.
•Linkage Method (Hierarchical Clustering only): Select the linkage method to be used for Hierarchical clustering.
|
Single linkage |
The shortest link between the points in the groups is used. This method is very fast; however, it tends to create somewhat of an unbalanced tree. |
|
Complete linkage |
The longest link between the points in the groups is used. This method is fast and tends to create a fairly balanced tree. |
|
Centroid linkage |
The distance between the centroids of the groups is used. This method tends to create a somewhat balanced tree that represents the differences and similarities in the data fairly well. This method is reasonably quick, although it is slower than Single and Complete linkage methods. |
|
Average linkage |
The average distance between all of the points in the groups is used. This method tends to create good results, similar to those produced by the Centroid linkage method, but is much slower. |
•Gene Clusters (k-Means Clustering only): Enter the maximum number of gene clusters to be created. The maximum value allowed is 100.
•Experiment Clusters (k-Means Clustering only): Enter the number of experiment clusters to be created. This field is only active if the Cluster Experiments box has been checked. Note that the number of resulting experiment clusters will be limited by the number of experiments selected in the Experiments section of the dialog. (See below.)
•# of Trials (k-Means Clustering only): Enter the number of trials for k-Means Clustering.
•Random Seed (k-Means Clustering only): The random seed is the value that initializes the pseudo-random number generator within the k-Means Clustering algorithm.
If k-Means Clustering is repeated on the same data set using the same parameters, choosing the same random seed will cause the generator to produce exactly the same sequence of numbers for a given set of distances and hence exactly the same result. Choosing a different seed value in this case would produce an alternative sequence of numbers which may introduce some variation in the result.
For multiple trials, the random seed value is used to generate the random seeds of the individual trials. The Info Pane will display the “Starting random seed” that is used to initialize the trials and the “Random seed of winning trial” for the results that are displayed.
•Genes: Define which genes should be clustered by choosing from the drop-down menu:
o “Selected” will cluster only the currently selected data points.
o “All” will cluster all of the data points in the project.
o Any gene sets you have created will also be listed in the drop-down menu. Selecting a gene set will cluster only the data points within that gene set.
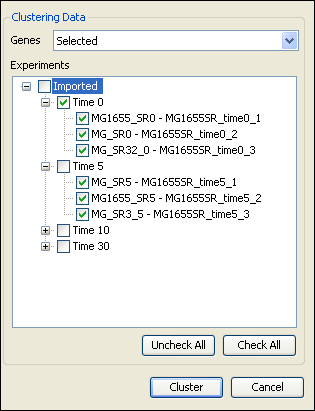
•Experiments: Define which experiments should be clustered by selecting them from the list provided on the right side of the Clustering Parameters window.
To cluster individual experiments, rather than the averaged experiments within a replicate set, select the checkboxes next to the individual experiments, rather than the replicate set name.
For example, in the image below, the “Time 0” replicate set will be treated as a single experiment, but the 3 experiments within the “Time 5” replicate set will each be clustered as individual experiments.