To access the Line Graph Thumbnails view, choose Graphs > Line Graph Thumbnails from the menu.
The Line Graph Thumbnails view is composed of several elements. The graphical display on the left is discussed in this topic. The toolbar tools above the graphical display and the Info Pane on the right are described in separate topics.
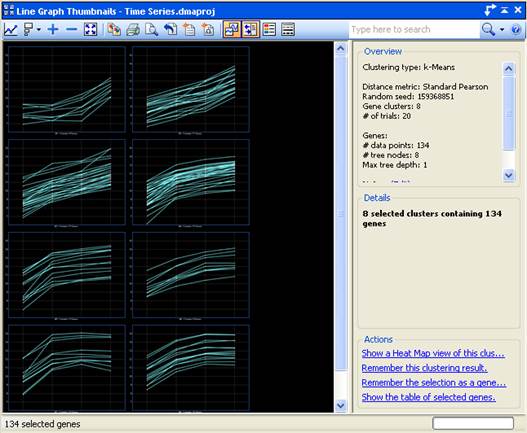
The Line Graph Thumbnails view displays a series of Line Graphs generated from a clustering. Each individual Line Graph shows a visualization of the data contained within one cluster.
Signals are plotted vertically along the Y-axis, while the X-axis position for each point is determined by the experiment to which it belongs. Mouse-over a vertical gridline to view the experiment name.
The number of clusters displayed is determined automatically. Alternately, you can easily define the number of clusters to be created by adjusting the Clustering Parameters.
The Line Graph Thumbnails view is best used to display k-Means Clustering results. Access the Line Graph Thumbnails view by selecting Graphs > Line Graph Thumbnails or Clustering > k-Means.
For a closer inspection of the results, double-click on a cluster to open that data set in the Line Graph view. One or more clusters can be selected and then re-clustered to aid in further teasing apart potential regulatory connections. Shift-click on the desired clusters, then choose Clustering > k-Means. The selected clusters will be re-clustered and displayed in a new Line Graph Thumbnails view.
Right-click on a Line Graph Thumbnail to access the following context menu commands:
|
When this many line graph thumbnails are selected |
… these commands are available |
Command description |
|
≥ 0 thumbnails |
Show Gene Table |
Shortcut to Data > Show Gene Table. |
|
Remember Clustering Results |
Shortcut to Clustering > Remember Clustering Result. | |
|
Select All |
Shortcut to Edit > Select All. | |
|
Copy Image |
Shortcut to Edit > Copy Image of Graph or to
the Copy Image tool ( | |
|
Fit to View |
Same as using the Fit to View tool ( | |
|
≥ 1 thumbnail |
Edit Cluster ‘x’ Notes |
Launches the Edit Cluster Notes dialog, already populated with the cluster name. Equivalent to clicking on the “Notes (Edit)” link in the Details panel. |
|
Remember Gene Set |
Shortcut to Data > Remember Selected [Genes, SNPs, Table Rows, etc.]. | |
|
Clear Selection |
Shortcut to Edit > Clear Selection. | |
|
Export |
Shortcut to File > Export Selected Genes. |
 ).
). ).
).