 .
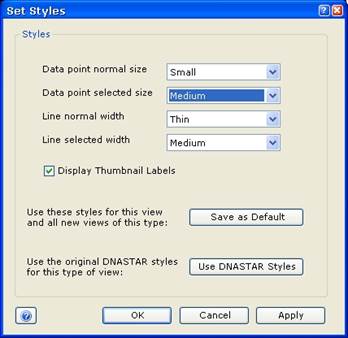
. Preferences for the display in the Line Graph Thumbnails view can be defined in
the Set Styles window. This window can be accessed by selecting Graphs >
Set Styles while the Line Graph Thumbnails view is active, or by clicking
the Style Settings tool .
.

Select your preferred size for normal (un-selected) and selected data points by choosing Small, Medium, or Large from the dropdown list.
Select your preferred width for the lines connecting the data points in each thumbnail graph by choosing Thin, Medium, or Thick from the dropdown list provided. Normal lines refer to those lines that are not currently selected.
Turn on or off the labels displayed under each thumbnail graph by checking or unchecking the box next to Display Thumbnail Labels.
After making changes, click Apply to apply the changes to the current view.
Or click Save as Default to save these changes as your new default settings.
Clicking Use DNASTAR Styles changes all values in the Set Styles window back to their original default settings.