 .
. The Info Pane appears to the right of the Scatter Plot, and gives information about the data
displayed. The Info Pane is separated from the rest of the Scatter Plot view by
a splitter bar which can be dragged to resize the window. The Info Pane may be
hidden or shown by using the Hide Info Pane tool .
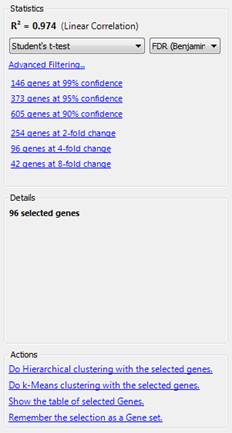
This section contains statistical information for the data plotted on the Scatter Plot.
The R2, or linear correlation, value is shown at the top . The R2 value is between 0.0 and 1.0 and has no units. When R2=1.0, all of the data will be plotted precisely on the identity line with no scatter. In other words, when R2=1.0, the data on both axes is the same.
Available statistical tests are listed in the first drop-down menu, and options for multiple testing corrections are displayed in the list on the right.
Selecting a statistical test from the list will automatically generate links showing different confidence levels and the number of genes associated with that confidence level. Confidence levels are a measure of the statistical significance that data indicating a gene is differentially expressed is reliable. Links showing various fold changes and the number of genes meeting that threshold are also listed.
Changing the current statistical test or multiple testing correction option from the lists provided will automatically update the links displayed, as well as any applicable data shown in the Details section (described below).
Clicking on any of the links in the Statistics section will select that set of genes on the Scatter Plot.
You may also define the percentage of confidence and fold change thresholds used to generate these links by entering your preferences in the Set Styles window.
Clicking on the Advanced Filtering link will open the Filter window so that you can further refine your selection. Criteria for the current selection will already be populated when the Filter window opens.
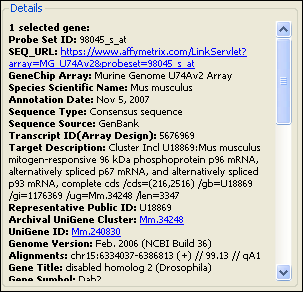
The Details section:
This section displays information about the currently selected genes, as well as the scale being used (logarithmic or linear), and the experiments currently selected for each axis. Using the mouse to hover over an individual data point in the Scatter Plot causes its details to be displayed in the Info Pane. Details vary according to the workflow and selection, but may include the gene name, all available annotations, signals, P-value, T/F value, fold change, SNP category, and/or notes.
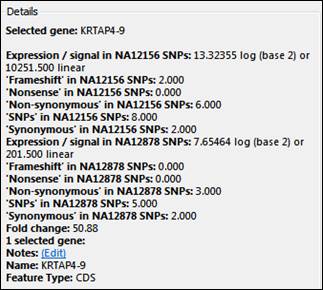
If you have selected exactly one gene, you can add a note about it by clicking on the “Notes: (Edit)” hyperlink.
When one gene is selected, you can also right-click within the Details panel to access the following context menu commands:
|
Annotation requirement |
Right-click command |
Command description |
|
No annotations necessary |
Modify gene information settings |
Shortcut to Data > Show Gene Table. |
|
Gene must contain annotations |
Quick search for |
Finds other genes in your project with the same annotation. |
|
Advanced search for |
Launches the Advanced Filtering dialog with the specified annotation already populated as a search criterion. |
Some annotations for the selected gene may have special features:
•Hover your mouse over annotations shown in color to display additional information.
•Click on hot links (shown in color with an underline) to link to additional information for that annotation online.
•For Gene Ontology terms, hovering your mouse over a term will display a more detailed description of the term. Clicking on a Gene Ontology term will link you to the full description online.
If multiple genes are selected, the Details section instead displays only the number of selected genes.

The Actions section:
The Actions section is located at the bottom of the Info Pane, and provides hyperlinked shortcuts for various tasks. Options vary depending on the view and workflow. See Actions Section Hyperlinks for a description of each hyperlink.
Note: If the Actions section is not visible, you may first need to select data from the left side of the view.