To access the Line Graph view, choose Graphs > Line Graph from the menu.
The Line Graph view is composed of several elements. The graphical display on the left is discussed in this topic. The toolbar tools above the graphical display and the Info Pane on the right are described in separate topics.
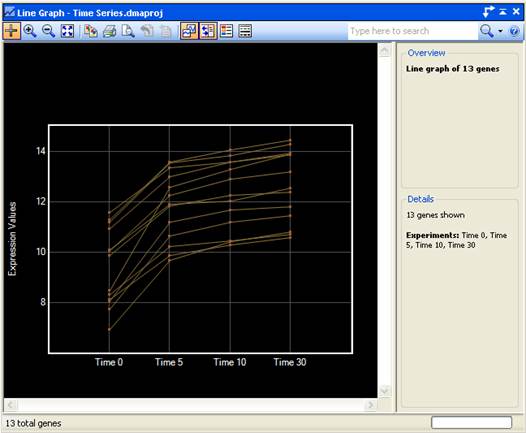
The Line Graph view plots the signals for selected genes over each experiment in your project, and then connects the data points with a line so that signals are shown relative to one another across the group of experiments.
Signals are plotted vertically along the Y-axis, while the X-axis position for each point is determined by the experiment to which it belongs. This allows visual comparison of gene signals across the entire series of experiments or conditions.
Right-click on a Line Graph to access the following context menu commands:
|
When you right-click on this… |
… these commands are available |
Command description |
|
Black space |
Show Gene Table |
Shortcut to Data > Show Gene Table. |
|
Select All |
Shortcut to Edit > Select All. | |
|
Copy Image |
Shortcut to Edit > Copy Image of Graph or to
the Copy Image tool ( | |
|
Fit to View |
Shortcut to the Fit to View tool ( | |
|
Any unselected line |
Add ‘x’ to Selection |
Adds the currently selected items to the existing selection. |
|
Any selected line |
Remove ‘x’ from Selection |
(enabled only if a single line is selected) Removes the selected item from the existing selection. |
|
Remember Selection as a Set |
Shortcut to Data > Remember Selected [Genes,
SNPs, Table Rows, etc.] and to the Remember Gene Set tool ( | |
|
Clear Selection |
Shortcut to Edit > Clear Selection. |
 ).
). ).
). ).
).