 .
. The Info Pane appears to the right of the Line Graph, and gives information about the data
displayed. The Info Pane is separated from the rest of the Line Graph view by a
splitter bar which can be dragged to resize the window. The Info Pane may be
hidden or shown by using the Hide Info Pane tool .
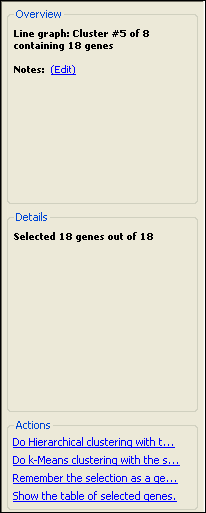
The Overview section:
This section displays general information about the current dataset, such as the number of genes displayed in the current Line Graph. If the Line Graph was part of a clustering, the cluster number as well as any notes for that cluster will be displayed in this section. Click the “Notes: (Edit)” link to add notes for the cluster.

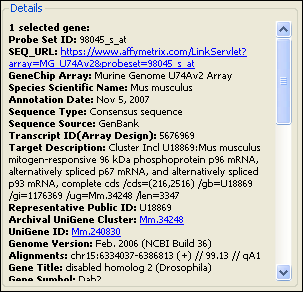
The Details section:
This section displays information about the currently selected genes. If no genes are selected, the section will list the total number of genes in the Line Graph, as well as the corresponding experiment names.

If you have selected exactly one item, you can add a note about it by clicking on the “Notes: (Edit)” hyperlink.
When one gene is selected, you can also right-click within the Details panel to access the following context menu commands:
|
Command |
Description |
|
Quick search for |
Finds other genes in your project with the same annotation. |
|
Advanced search for |
Launches the Advanced Filtering dialog with the specified annotation already populated as a search criterion. |

Some annotations for the selected gene may have special features:
•Hover your mouse over annotations shown in color to display additional information.
•Click on hot links (shown in color with an underline) to link to additional information for that annotation online.
•For Gene Ontology terms, hovering your mouse over a term will display a more detailed description of the term. Clicking on a Gene Ontology term will link you to the full description online.
If multiple genes are selected, then the number of genes selected is shown in this section. In addition, as your cursor moves over the Line Graph, details for each gene are displayed as you mouse-over them, including the gene name, annotations, notes, and the signal for the experiment your mouse is closest to.
The Actions section:
The Actions section is located at the bottom of the Info Pane, and provides hyperlinked shortcuts for various tasks. Options vary depending on the view and workflow. See Actions Section Hyperlinks for a description of each hyperlink.
Note: If the Actions section is not visible, you may first need to select data from the left side of the view.