The Venn Diagrams window lets you visually compare sets using Venn and “dartboard” diagrams. To access the Venn Diagrams view, choose Graphs > Venn Diagrams from the menu.
The Venn Diagrams view is composed of several elements. The graphical display on the left (which consists only of blue text at first) is discussed in this topic. The toolbar tools above the graphical display and the Info Pane on the right are described in separate topics.
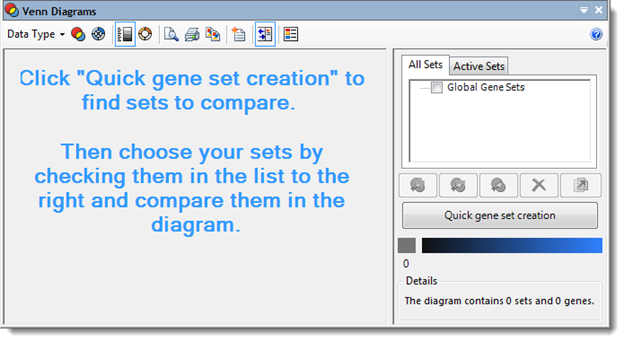
Before displaying a diagram, you must first select one or more sets to compare. These are chosen from lists in the All Sets or Active Sets tabs in the Venn Diagrams Info Pane. If you haven’t already created sets, or want to create different ones, you can use the Quick gene set creation button. See the Venn Diagrams Info Pane topic for detailed instructions on creating and selecting sets to use in Venn diagrams.
Once you have checked one or more sets in the All Sets or
Active Sets lists, a diagram will be displayed. Choose a specific display mode
by clicking either Venn Mode ( ) or Dartboard Mode (
 ) from the Venn Diagrams Toolbar. Note that in Venn
Mode, you can only display up to 3 sets at a time.
) from the Venn Diagrams Toolbar. Note that in Venn
Mode, you can only display up to 3 sets at a time.
In both the Venn and dartboard modes, each set is represented by a letter. Each section of the diagram will be labeled with the letter(s) corresponding to the set(s) represented in that section. For example, the section representing the genes or SNPs found only in set A and set B will be labeled “AB.” In Venn mode, the label also displays the number of genes or SNPs included in each set in parenthesis.
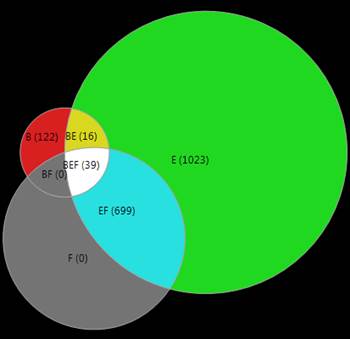
Venn mode:
In Venn Mode, the Venn Diagrams view displays a Venn diagram representing one to three gene or SNP sets. In this mode, each gene or SNP set is represented by a circle. The areas where the circles overlap represent groups of genes or SNPs that are common to two or three sets, depending on how many of the circles overlap. ArrayStar will attempt to draw the circles and intersections proportionally to the size of the sets being compared. However, in cases where this would make the display difficult to read, some of the sections may not be proportional in size to the group of genes or SNPs represented therein.
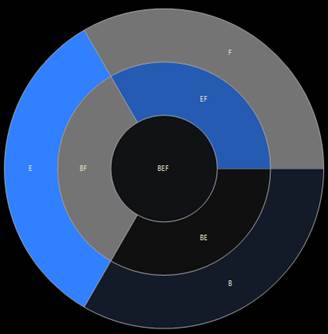
Dartboard mode:
In Dartboard Mode, the Venn Diagrams view displays a dartboard diagram representing one or more gene or SNP sets. The diagram is organized into levels, or rings, with the outermost ring containing a single section for each of the sets. The sections in the outermost ring represent the number of genes or SNPs that are unique to each set, to the exclusion of all the other sets. The second outermost ring contains sections corresponding to genes or SNPs unique to each combination of two sets, to the exclusion of all other sets. The third ring contains sets of genes or SNPs unique to each combination of three sets, and so on. This pattern continues for as many levels are there are sets. The middle, innermost level, always represents the group of genes or SNPs that are common to all sets represented in the diagram. An advantage of using the dartboard diagram is that the maximum number of sets that can be represented is limited only by your screen resolution.