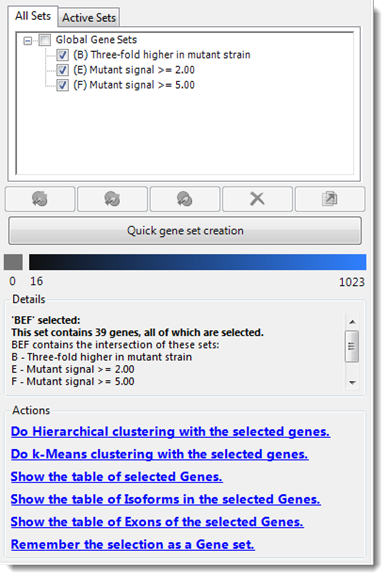
The Info Pane appears to the right of the Venn Diagrams view.
•The section above the blue bar lets you view, select and create gene sets to compare in the Venn diagram.
•The section below the blue bar displays information about the data in the Venn diagram and provides links to actions that can be performed.
The Info Pane is separated from the rest of the Venn Diagrams
view by a splitter bar which can be dragged to resize the window. The Info Pane
may be hidden or shown by using the Hide Info Pane tool  .
.
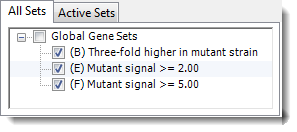
The Set List section:
This two-tabbed section allows you to view a list of All Sets or limit the list to Active Sets.
•The All Sets tab contains a hierarchical tree of all the sets saved in the project, as well as any quick gene sets you have created using the Quick gene set creation button immediately below the Set List section. The list contains the same sets displayed in the Set List.
Selections made in the All Sets or Active Sets lists are used in the comparison diagrams on the left of the view. To add or remove sets from the diagram, check or uncheck boxes corresponding to those sets. If more than three sets are checked, the diagram will automatically switch to Dartboard mode.
You can also select sets by single-clicking on them to highlight them. Select multiple sets by Shift+clicking or Ctrl+clicking on them. Once a selection has been made, you may then use the following tools to modify the diagram and set list:
|
Tool |
Function |
|
|
Add selected sets to diagram |
|
|
Remove selected sets from diagram |
|
|
Create diagram from selected sets |
|
|
(currently disabled) |
|
|
(currently disabled) |
•The Active Sets tab contains a table which displays the name, letter ID, and number of items (e.g., genes, SNPs, etc.) in the sets currently displayed in the Venn or dartboard diagram.
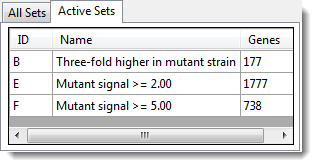
You may select sets from this table by clicking on the corresponding rows. This will also cause the highlighted set(s) to be selected in the diagram itself, and the items in the set will be selected in all applicable views.
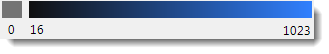
The Color Scale section:
The color scale used to display the number of items in each set in dartboard diagrams is displayed in the center of the Info Pane.
This color gradient is used for Quantitative Shading
in the Dartboard diagram. By default, quantitative shading is used. You may
turn this feature on or off by clicking the Quantitative Shading tool
( ).
).
The two colors on the extreme ends of the color scale
represent the shading for the minimum and maximum set sizes, respectively. The
minimum value corresponds to the number of items in the smallest set, excluding
empty sets. The maximum value corresponds to the number of items in the largest
selected set. A separate color is used to represent all sets with zero items.
Click the Color Settings tool ( ) to change the colors for the minimum,
maximum, and zero values in the Set Colors window.
) to change the colors for the minimum,
maximum, and zero values in the Set Colors window.
The Details section:
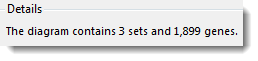
This section shows information about the currently selected sets or items. If no items are selected, this section will list the number of sets and the total number of items represented in the diagram.
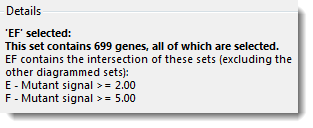
If items (e.g. genes, exons, etc.) are selected, this section will list how many of the items represented on the diagram are selected. If an entire set is selected, the section will list how many items are in the set and, when applicable, what sets intersect at the current set.
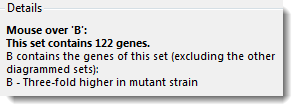
Hover your mouse over different sections in the diagram to display information about a given set without selecting it.
The Actions section:
The Actions section is located at the bottom of the Info Pane, and provides hyperlinked shortcuts for various tasks. Options vary depending on the view and workflow. See Actions Section Hyperlinks for a description of each hyperlink.
Note: If the Actions section is not visible, you may first need to select data from the left side of the view.


