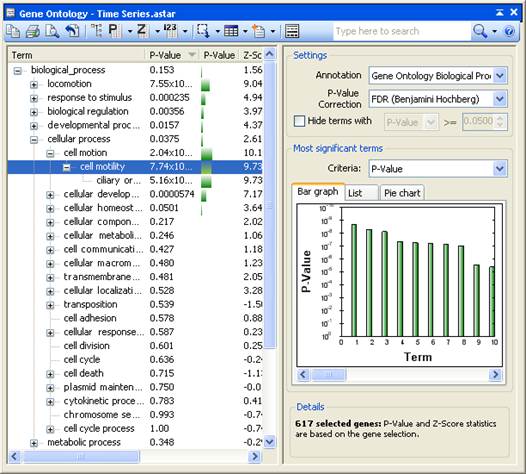
ArrayStar’s Gene Ontology view, accessed via the Data > Show Gene Ontology command, aids you in determining the biological significance of a gene selection by displaying currently selected genes in relation to a designated annotation field. Additionally, this view can be used to find and select a set of genes that is annotated with one or more ontology/classification terms. Gene sets, filtering or a selection can also be analyzed in this view.
The Gene Ontology view is composed of several elements. The graphical display on the left is discussed in this topic. The toolbar tools above the graphical display and the Info Pane on the right are described in separate topics.
Note: ArrayStar's ability to Filter Based on Gene Classification/Ontology offers an additional way to explore gene ontology.
The graphical display on the left shows the terms and statistics for the designated annotation field.
•To view the full name, ID and description for a term, hover over it with the mouse.
•To sort the columns, click on any column header to sort the tree/list by that column. Or click on the Term column to sort the names of terms alphabetically.
•To select all of the genes in the project that are annotated with a term, double-click on the term.
If the annotation field selected from the Info Pane is a Gene Ontology field, then the Gene Ontology terms will be displayed in a hierarchical tree. Only those terms (and their parent terms) actually contained with the current project will be displayed.
Note: ArrayStar downloads the Gene Ontology tree structure from the Gene Ontology Consortium. If you wish to download and import Gene Ontology information, open the Download Annotations dialog by clicking Data > Download Annotations.
If the annotation field selected from the Info Pane is a classification term, then the terms are displayed in the form of a list. An annotation is considered a classification term if at least 2/3 of its values occur for more than one gene.
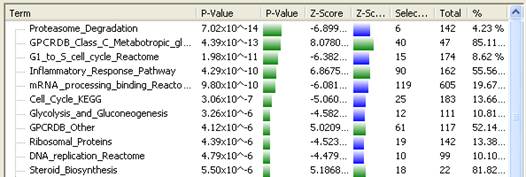
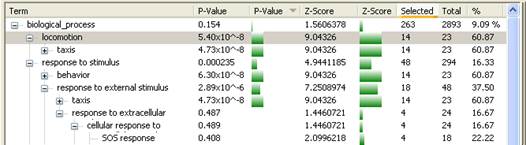
The columns in the Gene Ontology view are defined as follows:
•Term – The Gene Ontology or classification term.
•P-value – A P-value, representing the probability that the number of genes currently selected for the term occurred by chance. In general, the lower the P-value, the greater the likelihood that the term is significant.
•P-value graph - A graphical representation of the P-value. The number graphed is a logarithmic calculation [-10 x log10(P)] of how closely the P-value approximates “zero.” A P-value of 1.0 is graphed as “zero,” a P-value of 0.1 is graphed as “one,” etc. If all P-values are equal to 1.0, the graph will therefore appear blank.
•Z-score – The number of standard deviations the term is away from the expected number of genes selected. This is useful in determining if the term is over- or under-represented in the current gene selection.
Note: A positive Z-score indicates a positive correlation, while a negative number denotes a negative correlation. Since both types of correlation are equally important, any filtering or sorting uses the absolute value of the Z-score and disregards whether values are positive or negative.
•Z-score graph – A graphical representation of the Z-score.
•Selected – The number of genes in the current selection for the term.
•Total – The number of genes contained within the entire project for the term.
•% - The percentage of genes for each term that are currently selected.
To learn how to use the Gene Ontology tools at the top of the view, see Gene Ontology Toolbar.
Right on a Gene Ontology term to access the following context menu commands:
|
Right-click when this is selected… |
… to access these commands |
Description |
|
One term |
Select Current [Term] Genes in All Views |
Shortcut to the Select All [term] Genes in All Views
tool ( |
|
Select Current [Term] Genes and Show Results in Gene Table |
Shortcut to the Select All [Term] Genes and Show
Results in Gene Table tool ( | |
|
Remember Current [Term] Genes as Gene Set |
Shortcut to the Remember All [Term] Genes as Gene
Set tool ( | |
|
Select All [Term] Genes in All Views |
Shortcut to the Select All [term] Genes in All Views
tool ( | |
|
Select All [Term] Genes and Show Results in Gene Table |
Shortcut to the Select All [Term] Genes and Show
Results in Gene Table tool ( | |
|
Remember All [Term] Genes as Gene Set |
Shortcut to the Remember All [Term] Genes as Gene
Set tool ( | |
|
Copy Selected Terms |
Shortcut to the Copy Selected Terms tool ( | |
|
Advanced Search for [Term] in GO ID |
Opens the Advanced Filtering Dialog, with the selected term and annotation field already populated. | |
|
Open [Term] in Web Browser |
Links to the full description of the selected term online. | |
|
Multiple terms |
Select These ‘n’ Terms’ Current Genes in All Views |
Shortcut to the Select All of these ‘n’ Terms’
Current Genes in All Views tool ( |
|
Select These ‘n’ Terms’ Current Genes and Show Results in Gene Table |
Shortcut to the Select All of these ‘n’ Terms’
Current Genes and Show Results in Gene Table tool ( | |
|
Remember These ‘n’ Terms’ Current Genes as Gene Set |
Shortcut to the Remember All of these ‘n’ Terms’
Current Genes as Gene Set tool ( | |
|
Select All of these ‘n’ Terms’ Current Genes in All Views |
Shortcut to the Select All of these ‘n’ Terms’
Current Genes in All Views tool ( | |
|
Select All of these ‘n’ Terms’ Current Genes and Show Results in Gene Table |
Shortcut to the Select All of these ‘n’ Terms’
Current Genes and Show Results in Gene Table tool ( | |
|
Remember All of these ‘n’ Terms’ Current Genes as Gene Set |
Shortcut to the Remember All of these ‘n’ Terms’
Current Genes as Gene Set tool ( | |
|
Copy Selected Terms |
Shortcut to the Copy Selected Terms tool ( |
Note: If a branch node is selected, ArrayStar will not automatically search for the terms underneath it. To search for the child terms of a branch node, see Filtering Based on Gene Classification/Ontology.
 ).
). ).
). ).
). ).
).