 .
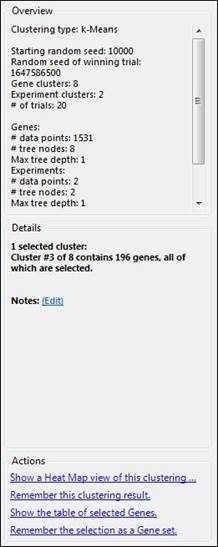
. The Info Pane appears to the right of the Line Graph Thumbnails view and gives
information about the data displayed. The Info Pane is separated from the rest
of the Line Graph Thumbnails view by a splitter bar which can be dragged to
resize the window. The Info Pane may be hidden or shown by using the
Show/Hide Info Pane tool  .
.
The Overview section:
This section displays the parameters that were used to do the clustering displayed in the Line Graph Thumbnails view. Included are the clustering type, distance metric, starting random seed value, random seed of winning trial, the number of gene clusters, and the number of trials. This section also includes information about the genes displayed in the clustering: the number of data points clustered, the number of tree nodes, and the maximum tree depth.

Parameters can be adjusted by selecting Clustering >
Advanced Clustering to access to the Clustering Parameters window. You may also add
notes to your clustering result by clicking on the “Notes: (Edit)” link
in the Overview section. In order to view your notes later, make sure to save
your result by selecting Clustering > Remember Clustering Result or by
clicking the Remember Clustering Result tool .
.
The Details section:
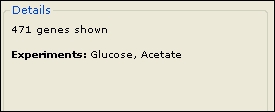
This section displays information about the genes displayed in your clustering. If no genes are selected, this section will list the total number of genes in the clustering, as well as the corresponding experiment names.

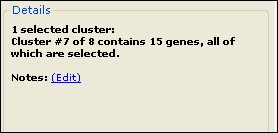
If only one cluster is selected, details for the selected cluster will be displayed, including how many genes are in the cluster, as well as the number that are currently selected. Any notes that you have entered for the cluster will also be displayed. Click the “Notes: (Edit)” link to add notes for the selected cluster.

As your mouse moves over each cluster, the number of genes in the cluster, the number selected, and any notes will also be displayed. If more than one cluster is selected, this section will display the number of clusters selected, as well as the total number of genes in the selection.

The Actions section:
The Actions section is located at the bottom of the Info Pane, and provides hyperlinked shortcuts for various tasks. Options vary depending on the view and workflow. See Actions Section Hyperlinks for a description of each hyperlink.
Note: If the Actions section is not visible, you may first need to select data from the left side of the view.